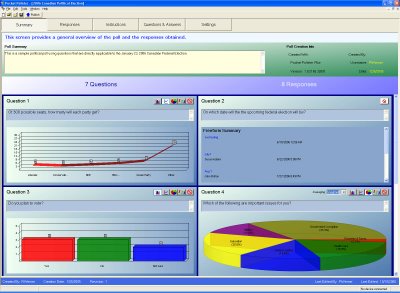
- Bar Charts
- Line Charts
- Pie Charts
- Textual Summary
 Each is fairly self-explanatory but there are some additional special features too:
- Some answer formats allow the data to be summarized in a "Simple" or a "Weighted" manner.
- The Freeform answer format, which contains purely textual data, has its own way of summarizing the responses.
- There's also a "No Chart" option. This is for those circumstances when none of the summary methods adequately displays the collected data; rare, but possible.
These new features are contained in Alpha Version 1.3. If you don't yet have access to it then please sign up for our Alpha Testing program.
